- Community
-
Programs
- Schools
-
Careers
- RN Specialties
- Best RN Jobs and Salaries
- Aesthetic Nurse
- Nursing Informatics
- Nurse Case Manager
- NICU Nurse
- Forensic Nurse
- Labor and Delivery Nurse
- Psychiatric Nurse
- Pediatric Nurse
- Travel Nurse
- Telemetry Nurse
- Dermatology Nurse
- Nurse Practitioner
- Best NP Jobs and Salaries
- Family NP (FNP)
- Pediatric NP
- Neonatal NP
- Oncology NP
- Acute Care NP
- Aesthetic NP
- Women's Health NP
- Adult-Gerontology NP
- Orthopedic NP
- Emergency NP
- Psychiatric-Mental Health NP (PMHNP)
- APRN
- Nurse Educator
- Nurse Administrator
- Certified Nurse Midwife (CNM)
- Clinical Nurse Specialist (CNS)
- Certified Registered Nurse Anesthetist (CRNA)
- Resources
- Education

The Survey
In February and March 2019, allnurses members and readers holding an active nursing license were invited via the allnurses website, newsletters, emails, and facebook to participate in a 10-minute online nursing salary survey. Participants answered 37 questions about their educational background (degree, license), level of experience, age, geographic location, nursing specialty, Nurse/Patient Ratios, and more. With much discussion in the news as well as on allnurses regarding unsafe staffing, staff cuts, violence in the workplace and other factors, we wanted to gain insight regarding the overall job and career satisfaction of nurses. The specific data gathered through questions about Job and Career Satisfaction will be discussed in greater detail in a later article.
After 6 weeks, almost 8,200 responses were received, providing valuable data. This data will be shared with you in this and future articles through interactive charts which will allow you to customize your search.
Demographics
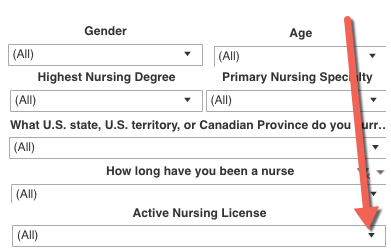
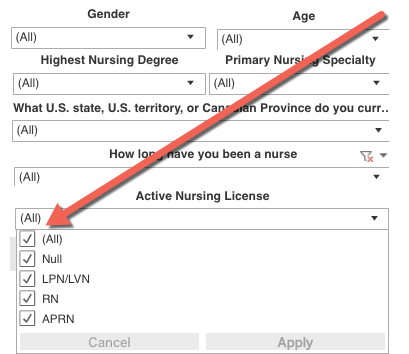
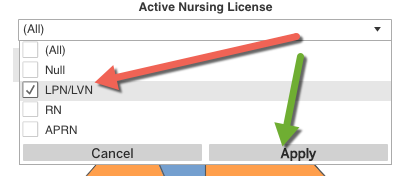
This first article focuses on the demographic profiles of the participants. Clicking on the filters at the top of the charts will allow you to change the data for Gender, Age, HIghest Nursing Degree, License, Primary Nursing Specialty, Geographic Location and Length of Nursing Experience.
Gender
It is no surprise that the nursing profession is still dominated by females - 93.55% vs 6.45%. Feel free to click on the various ages to see if there is a shift one way or the other.
Age
There continues to be an upward shift in the age of nurses. The 50 and over age group comprises 44.12% of the workforce for 2019 compared to 41% for 2018 and 30% in 2017. The age group with the highest percentage of nurses is in the 50 - 59 age bracket registering 24.74% strong.
Degree
The majority of the respondents have a BSN or ADN/ASN Degree (48.80% and 35.75% respectively), followed by Diploma (5.61%), MSN (8.97%), DNP (0.48% ), PhD (0.34%), and DNSc (0.04%). There has been an upward shift in all degrees except for Diploma, DNSc, and ADN/ASN. ADN/ASN percentage has dipped from 40.47% in 2018 to 35.75% in 2019, widening the gap with BSN degree nurses who have grown from 45.16% in 2018 to 48.47% in 2019.
Specialty
There has not been any change in the top 5 specialties from last year. Med/Surg stills ranks first with 11.28%. Other popular specialties are Geriatrics (8.04%), Emergency (6.03%, Cardiac (5.0%) and OB/GYN (4.47%). Scroll through the filters to see where your age group, gender, and level of experience falls.
Please add to the comments below regarding any data or trends you see that are surprising.
About tnbutterfly - Mary, BSN
Share this post
Share on other sites